Strong Bad Email Statistics
From Homestar Runner Wiki
BazookaJoe (Talk | contribs) m (sp) |
m (Found me a typo.) |
||
| Line 1: | Line 1: | ||
[[Image:NoLoafingPieChart.png|thumb|No Loafing!]] | [[Image:NoLoafingPieChart.png|thumb|No Loafing!]] | ||
| - | With more and more [[Strong Bad Email]] released on the [[Homestar Runner (flash cartoon)|Homestar Runner website]], it is hard to keep track of all the statistics. For example, which computer was used the most, or how the length of emails has increased throughout the | + | With more and more [[Strong Bad Email]] released on the [[Homestar Runner (flash cartoon)|Homestar Runner website]], it is hard to keep track of all the statistics. For example, which computer was used the most, or how the length of emails has increased throughout the years. To correctly calculate those numbers, a few charts and graphs have been made for the ease of the people who like to know ''everything'' about [[Strong Bad]] and his emails. |
<h2 style="clear: both;">Strong Bad Email By Length</h2> | <h2 style="clear: both;">Strong Bad Email By Length</h2> | ||
Revision as of 23:52, 23 August 2005
With more and more Strong Bad Email released on the Homestar Runner website, it is hard to keep track of all the statistics. For example, which computer was used the most, or how the length of emails has increased throughout the years. To correctly calculate those numbers, a few charts and graphs have been made for the ease of the people who like to know everything about Strong Bad and his emails.
Contents |
Strong Bad Email By Length
This section involves data taken from the list Strong Bad Email By Length.
- The scatter plot shows a fairly strong positive correlation between Email Number and Email Length. The r value between these two variables without deleting outliers is .736.
- An r value of 1 would indicate a perfect, positive correlation. A value of -1 indicates a perfect, negative correlation. Therefore, .736 indicates a fairly strong, positive correlation.
- This plot shows there are a handful of clear outliers which are likely affecting the correlation. In the plot below, the outliers have been removed. A Least Squares Regression Line (LSRL) has also been added.
- The outliers were defined as those emails with a residual value of 40 or greater, or -40 or less.
- The LSRL can be used to extrapolate, or guess the length of future emails. The r value of this line is .946.
- The equation for the LSRL is y = 1.3848x + 44.831. y = Time (seconds); x = Email number
- This method of guessing is not 100% accurate, since it is unlikely the e-mails will ever be, say, 20 minutes long. This equation should not be considered a foolproof method for guessing the length of an e-mail.
Strong Bad Email By Era

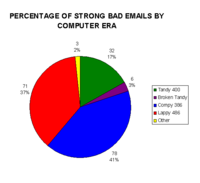
This section involves data on the computer used to answer each e-mail, or the "era" of the computer. The categories are Tandy 400, Broken Tandy, Compy 386, Lappy 486, and Other. (So far, other is Pom Pilot and Tangerine Dreams)
Strong Bad Emails Featuring More Than One Email
Several Strong Bad Emails feature more than one email.
- huttah! — 7 emails
- spring cleaning — 5 emails
- 50 emails — 4 emails
- cheatday — 4 emails
- E-mail Birds — 3 emails
- 2 emails — 3 emails (third is fast-forwarded through)
- bottom 10 — 2 emails
- credit card — 2 emails
- lady...ing — 2 emails
External Links
- View the data (Excel Spreadsheet) 45KB, current as of 19 August 2005.


